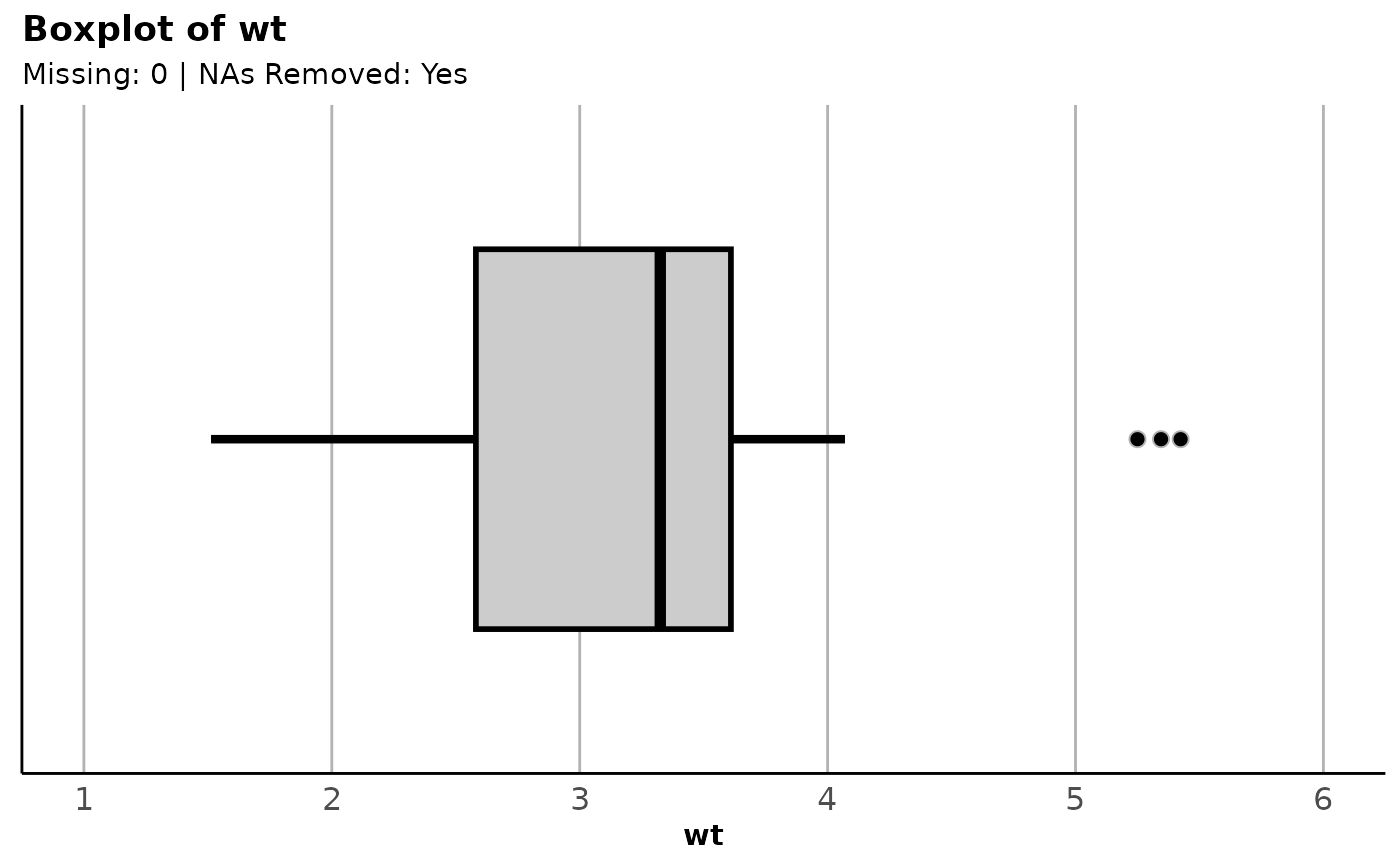
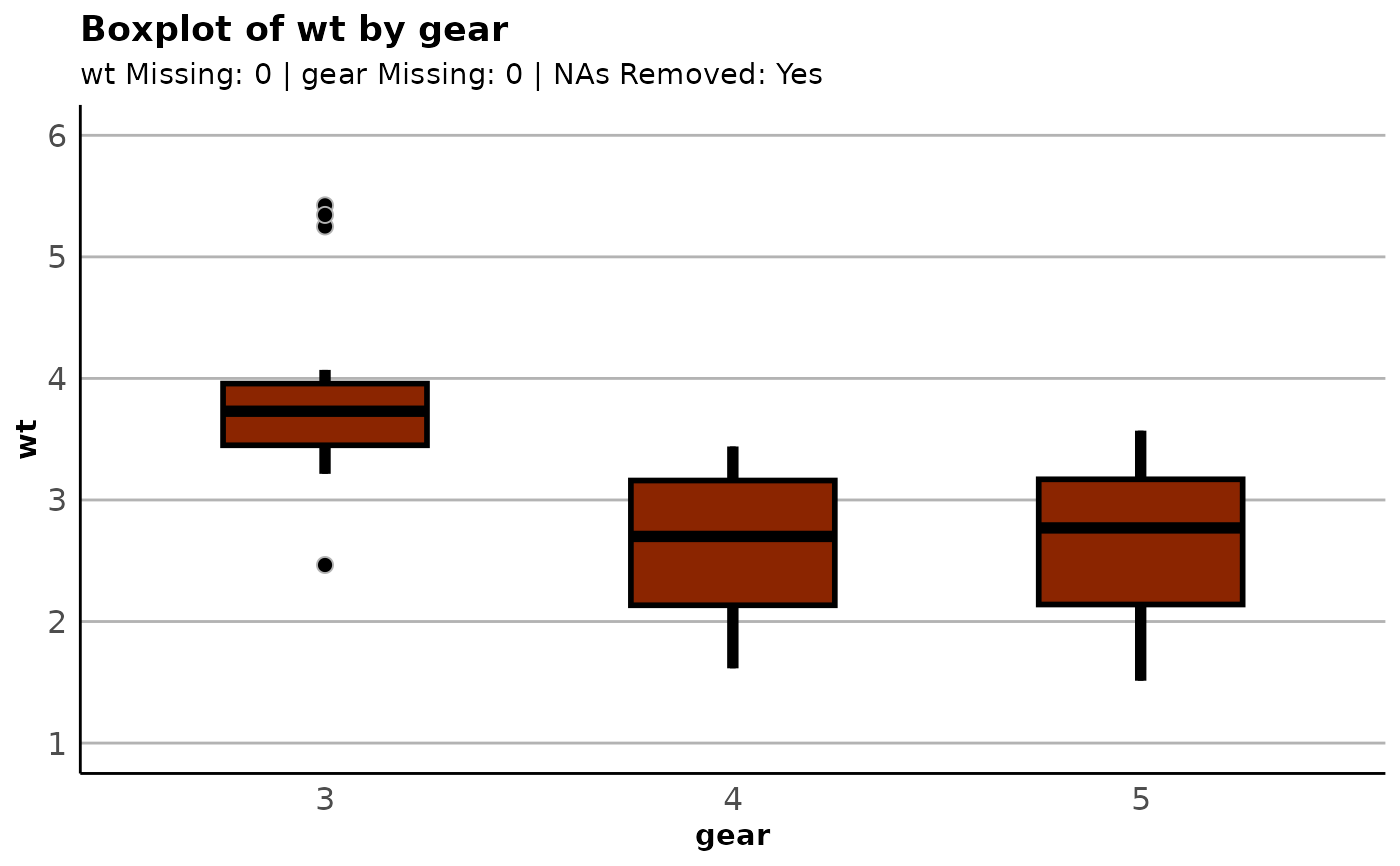
plot_box() builds a simple, pre-themed boxplot on one variable alone or grouped by another variable.
Arguments
- data
A data frame.
- formula
Variables entered in formula notation. Either
~varfor a one-variable boxplot orvar1~var2for a grouped boxplot wherevar2is a grouping variable.- fill
The fill color for the boxplot. Entered as a character.
- breaks
A vector of length 3 (start, stop, step) specifying how the x-scale should be broken up.
- orient
The orientation for the plot (either "vertical", the default, or "horizontal"). As a shortcut, "v" and "h" may be used.
- title
An override for the title of the plot. A sensible default is provided.
- subtitle
A switch for hiding the default subtitle. One of "show" or "hide".
- ...
Extra title arguments passed on to
ggformula::gf_labs()(which feeds toggplot2::ggplot()).